
If you want to watch the YouTube video on this post check out the video below.
Before we get into how to read a 12 lead ECG, we recommend that you review the normal anatomy and conduction pathways of the heart.

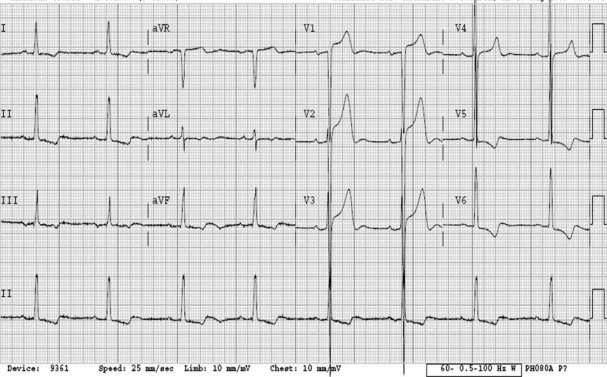
When you see a 12-lead do you freeze and get overwhelmed? It happens to everyone especially when you first start interpreting 12 leads. We’ll go into how to break down a 12-lead to help you get out of a pickle. But first, the leads and what part of the heart they show.

Is this kind of what you think of when you look at a 12 lead? Well let me make it easier.

There’s not much to note on the previous images. They simply reference the anatomical region that each lead views. But because we are SCOPE, we thought we would add a mnemonic in there to help you guys remember that.

The mnemonic is “I See All Leads” and you can add in “on a 12 lead” at the end if you wish.
I- Inferior
See- Septal
All- Anterior
Leads- Lateral
Below is 6 step approach to interpreting a 12 lead ECG.

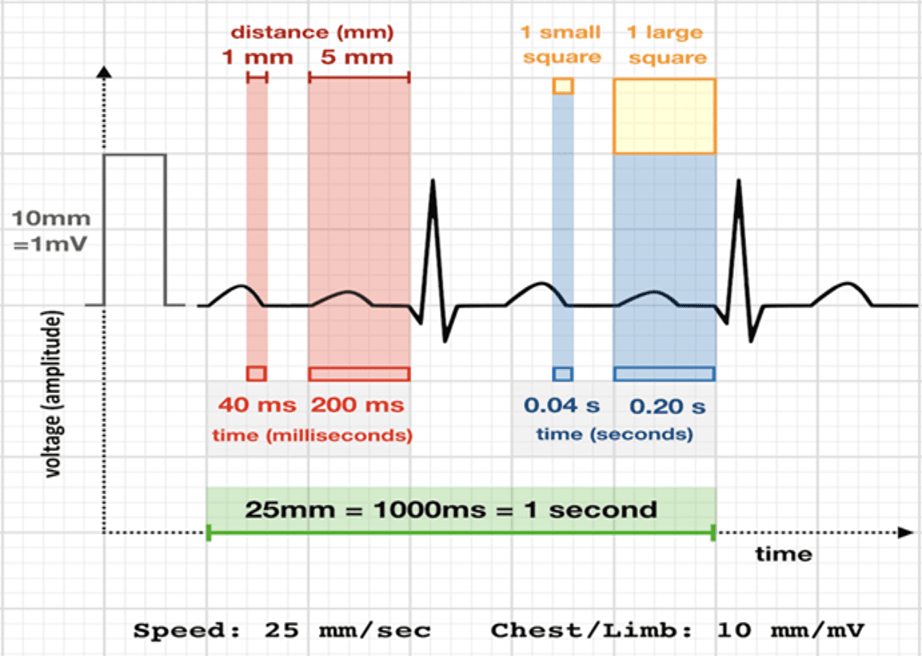
What is the rate of the rhythm? Find a QRS complex that is on the line of a big box. If the next QRS complex occurs at the next big box, the rate is around 300, if occurs two big boxes away the rate is 150, and so on and so on (picture above will provide the rest of the rates). This is called the “big box method” and is a fairly easy way to quickly get the rate.
A rate greater than 100 beats per minute= tachycardia
A rate between 60-100 beats per minute= normal
A rate less than 60 beats per minute= bradycardia
For patient’s with an irregular heart beat, you may need to count the whole rhythm strip (normally 10 seconds) and multiply by the amount of QRS complexes.
2. Rhythm/Regularity
Next, determine if the rhythm is sinus in nature (determine if the impulses occur from the SA node). You can do this by looking for a positive P wave in leads I and II and a negative P wave in aVR. There should be 1:1 ratio of P waves to QRS complexes. Determine if the rhythm is regular, regularly irregular (sinus with ectopy/ sinus arrhythmia), or irregularly irregular rhythm (atrial fibrillation, WAP, MAT).
3. Axis

Many people glance over and don’t even look at axis because they think its to complex and hard. Above is a picture of how to determine the axis of a 12-lead. You look at the QRS complex and determine if it’s positive (or mostly positive), negative (or mostly negative), or indeterminate (equally positive and negative). Why is this important? The axis can point to underlying health issues and can help you come up with a differential diagnosis. Here are some examples of what each axis can show.
Normal Axis: As the name suggests, this is normal.
Left Axis Deviation (LAD):
Right Axis Deviation (RAD):
Extreme Axis Deviation:
4. The Waveforms/Intervals

Here are the intervals and the normal ranges:
P wave: This shows the atria depolarizing. The amplitude is normally 0.05 to 0.25mV (0.5 to 2.5 small boxes). Have you ever had a super tachy rhyhtm and couldn’t tell if it is sinus tachycardia or SVT? Try doing a Lewis lead on your stable patients. This is mostly done in electrophysiology and in hospital settings, not much in a prehospital setting, but it is a useful tool to have. This focuses on the right atrium when you view lead I which allows you to more easily see atrial activity.

Normal duration is 0.06-0.11 seconds (1.5 to 2.75 small boxes). Below is a picture of the various types of P waves you might see on a 12 lead.
RAE- Right atrial enlargment
LAE- Left atrial enlargment

PR interval: 0.12 to 0.20 seconds or 120 to 200 milliseconds. Elongation of this can be caused by a first degree heart block. A short PRI can be caused by a preexcitation syndrome (Wolff Parkinson White syndrome or Lown-Ganong-Levine syndrome). Click the “ECG Rhythm Review” link below to learn about the different heart blocks and look at our WPW post for more information.
Q wave: A q wave is not always noted on every 12 lead ECG. But if it does occur, its the first negative deflection before the R wave in the QRS complex. You can sometimes see them in the lateral leads (I, aVL, V5 and V6).

Now Q waves are somewhat interesting. The normal Q wave is supposed to be small and narrow. There are a few Q waves you should be aware of:

2. Dagger Q waves: Deep narrow Q waves that can easily be greater than 25% of the QRS complex but are not wide.

Look over leads I, aVL, V4, V5, and V6 for deep narrow Q waves. Deep narrow Q waves and high voltage could indicate that your patient has hypertrophic obstructive cardiomyopathy.

QT interval: This is the distance from the Q wave to the end of the T wave. The normal QT interval is between 400-450ms. At the end of the day, you really only need to be concerned if its over 500ms because that predisposes patients to Torsades de Pointes.
QRS: The normal QRS duration is between 0.08 and 0.10 seconds. This represents the ventricles depolarizing. Some factors that can widen the QRS complex include:

2. Accessory pathway (such as the bundle of Kent in Wolff-Parkinson-White Syndrome (yes of course we have a post and a YouTube video on this topic).
3. Non-specific conduction delay
4. Electrolyte imbalances/drug overdoses
5. Pacemaker
T wave: The T wave depicts ventricular repolarization. The size of the T waves vary based on age, sex, and lead placement. Generally they’re asymmetric in nature. T waves should be upright in every lead except for aVR and V1.

Some conditions that can change the T wave appearance include:
5. Hypertrophy
Hypertrophy is a term that basically means the ventricles are becoming enlarged and thickening. There are two types:

Hypertrophy really only applies to patients over 35-40 years old (depending on the literature you read). Hypertrophy causes massive QRS complexes.
RVH
You need to have:

Some additional changes include right bundle branch block with a “strain pattern”. A strain pattern is slight ST depression and T wave inversions which you can see in the example above.
LVH
There are a ton of criteria for diagnosing left ventricular hypertrophy on a 12 lead but one of the easiest ones is the Sokolov-Lyon criteria which is the S wave depth in V1 + tallest R wave height in V5-V6. You add up the number and if its over 35, you got your answer. Another criteria is the Cornell criteria which states you add the R wave in aVL to the S wave in V3. If it is over 28mm in men or greater than 20mm in women its LVH. Now remembering all of the criteria is giving you a headache right? How about you look for just two things…
Look in the precordial leads (V1-V6).. See the massive QRS complexes? That’s your high voltage. Look over in V5, V6, I, II, and III. See the flipped T wave? That’s your strain pattern.
6. Infarction
Infarction is pretty simple to see on a 12 lead. So simple we shouldn’t really pat ourselves on the back for seeing it. If you are interested in picking up subtle STEMIs, check out our Occlusion MI post here:
But if you must know, STEMI criteria includes:
1mm of elevation in two contiguous leads with reciprocal depression

And that’s it! Well I lied, there are two circumstances you need to remember as well…
2. Due to a normal 12 lead not being able to see the posterior (back) of the heart, how will we know if the posterior wall is infarcting? Well look at the nifty image I have below. You look for ST depression in V1-V4. You should know that V2 is more sensitive. And then what? You perform a 15 lead. You basically move V4-V6 to the patient’s back. V4 becomes V7, V5 becomes V8, and V6 becomes V9. You only need 0.5 mm of elevation in V7-V9 to confirm a STEMI though. The reason why, is because there’s a lot more fat and muscle to look through to see the posterior wall of the heart.

Recap
Here are the steps you need to do on every single 12 lead you interpret:
And that’s it! The best advice I can suggest to people new at 12 lead interpretation is to fully look at one and just do the step by step approach. As time goes on it will become more automatic. The more you look at, the easier it will come to you. Now hopefully a lot of our ECG posts will make more sense to you. Medicine is all about baby steps. So take learning one step at a time.
This site is meant to be used for educational use only. We strive to push evidence based medicine with no bias to help you obtain all the important information. You should always follow your protocols that have been set in place.
Follow our social media to stay updated!
https://m.facebook.com/SCOPEeducation20/
https://twitter.com/scopeducation?lang=en
-Scopeducation Team (Matt and Ryan)
References
All of the pictures obtained have the links to them underneath each picture
My brain


1 Comment.